AI Agent Observability: What to Instrument Before Agents Touch Production
What to instrument when an agent runs multi-step work on your systems — the signals that matter, the failure modes request-level monitoring misses, and where approval gates fit.
6 min readby Prithvi

Your existing monitoring cannot see what an agent did
AI agent observability is the practice of capturing what an agent did across a whole task — every model call, tool call, retry and decision — so that when the outcome is wrong you can find the step that made it wrong.
The reason it needs a name of its own is that the two things companies already have do not cover it.
Application performance monitoring watches requests. It will tell you the agent endpoint returned HTTP 200 in 14 seconds. It has no opinion on whether the agent emailed the wrong customer, because from the infrastructure's point of view that was a successful request.
LLM monitoring watches model calls. It will tell you the token count, the latency and the cost of each completion. But a single agent task is not one model call. It is a sequence: read the thread, decide which tool to use, call the CRM, get a malformed response, retry, interpret, draft, send. Twelve model calls can each look healthy while the task as a whole goes wrong at step four and compounds from there.
The unit that matters for an agent is the task, not the request and not the completion. A good agent trace lets you open a single task and read it the way you would read a colleague's work: here is what it was asked, here is what it looked at, here is what it decided, here is what it changed. Most teams discover they cannot do this on the day a customer asks why they received a particular email.
Observability, monitoring and evaluation are three different jobs
These get used interchangeably and they answer different questions. Getting them straight tells you what you are missing.
| Question it answers | When it runs | What it cannot tell you | |
|---|---|---|---|
| Monitoring | Is the agent healthy right now? | Continuously, in production | Why a specific task went wrong |
| Observability | What did this task actually do, step by step? | After the fact, on any task | Whether the output was good |
| Evaluation | Is the agent's output correct against a standard? | Pre-deploy, and sampled in production | Whether today's traffic looks like your test set |
Most teams build these in the wrong order. They start with monitoring because it looks like infrastructure they already understand, get dashboards showing success rates near 100%, and conclude things are fine — until someone escalates a specific bad outcome and there is no trace to open.
The more useful order is observability first. Traces are what make the other two meaningful: evaluation needs real task traces to build a test set worth anything, and monitoring thresholds set without knowing what normal looks like are guesses.
One caution on evaluation specifically. An eval suite built from examples you invented measures the agent against your imagination. An eval suite built from traces of real tasks — including the ones that went wrong — measures it against your business. The second takes longer to assemble and is worth considerably more.
What to instrument
The test for each signal: when a task goes wrong, does this tell you something the others do not?
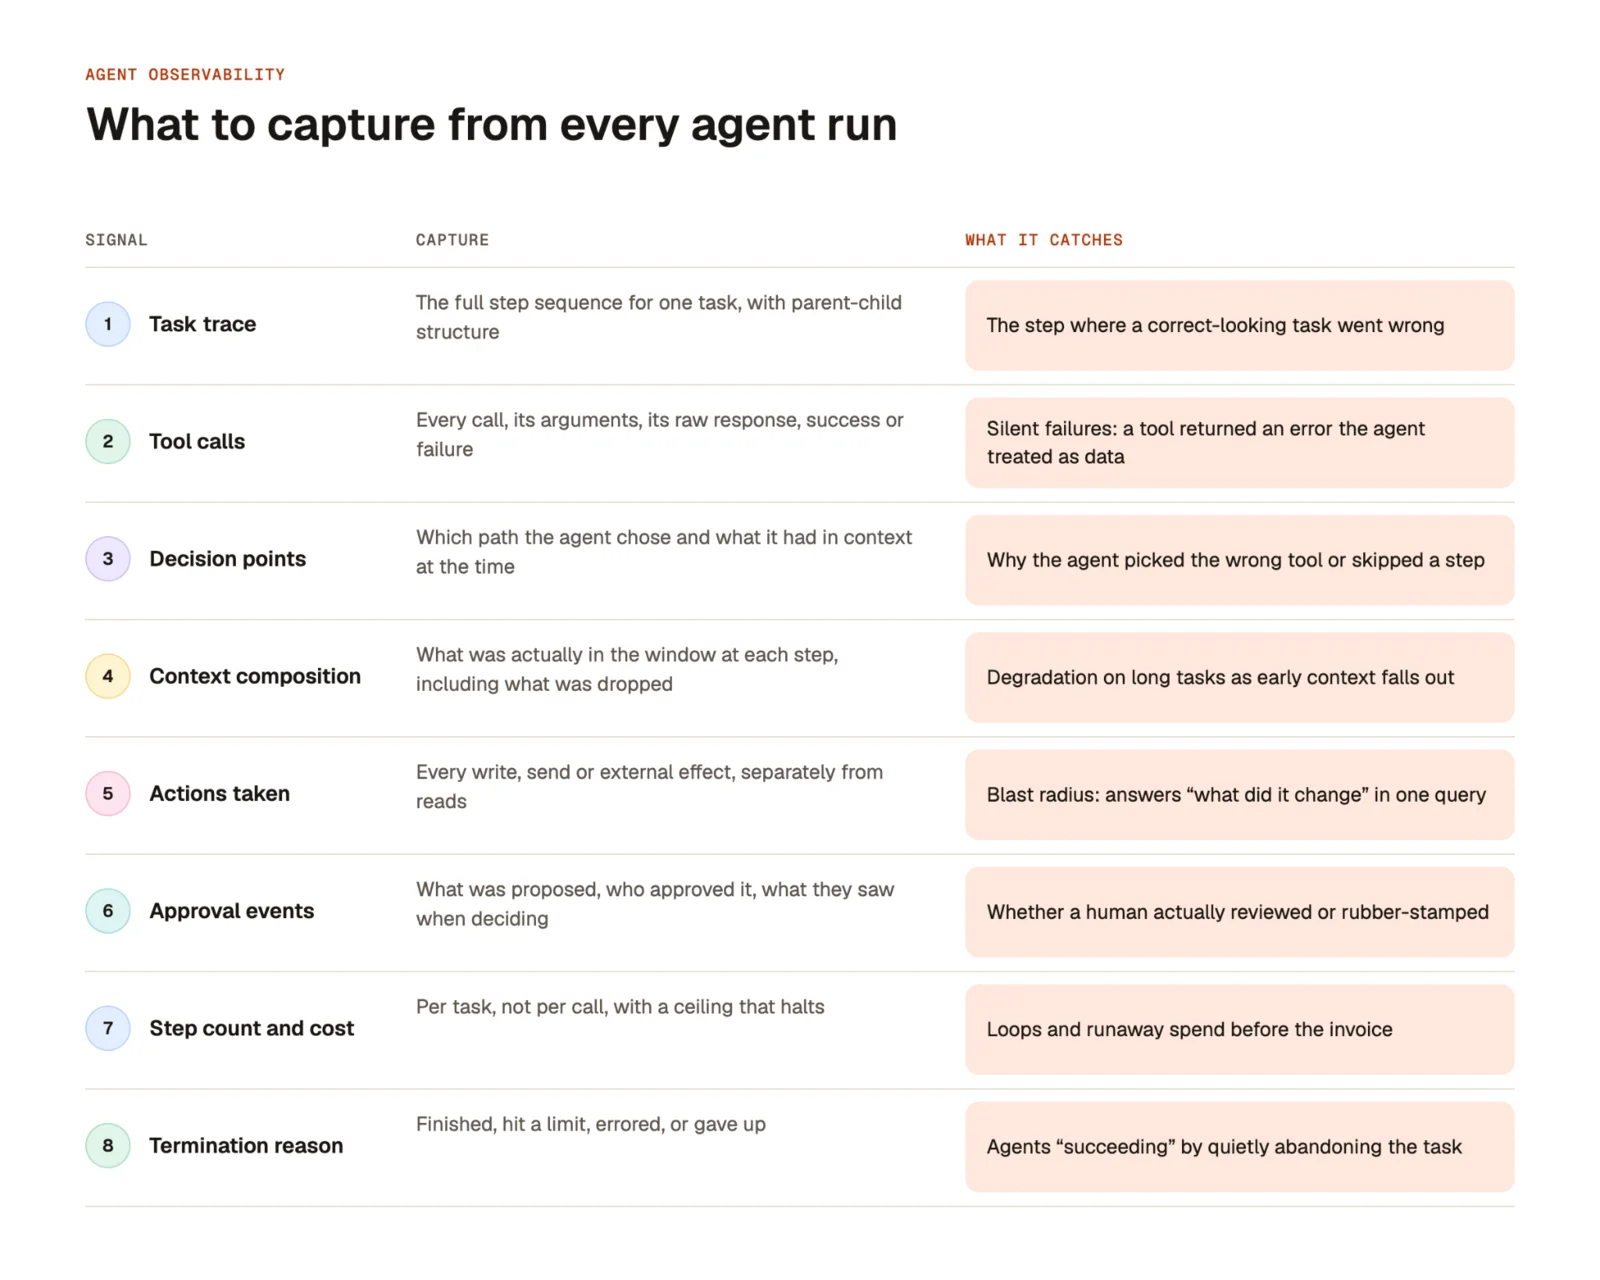
Two of these are routinely skipped and both are worth arguing for.
Actions, separately from reads. Most tracing treats every tool call alike. But the question asked after an incident is never "what did it look at" — it is "what did it change." Keeping writes in their own stream turns a forensic exercise into a filter. This is also what makes an audit trail possible rather than theoretical.
Termination reason. An agent that stops early frequently reports success. Without an explicit termination field, those tasks sit in your metrics as wins, and your success rate measures how often the agent stopped rather than how often it finished.
Four failures that only appear at task level
Each of these passes request-level monitoring cleanly. That is what makes them expensive.
Silent tool failure. A tool returns {"error": "rate limited"} with HTTP 200. The agent reads it as data, concludes the record is empty, and proceeds on a false premise. Infrastructure sees a successful call. The only place this is visible is a trace showing the raw tool response next to what the agent did with it.
Context drift. On a long task, early context falls out of the window as the agent accumulates intermediate results. By step nine it has forgotten a constraint stated at step one — the customer's stated budget, the instruction not to contact a particular person. Each individual step is reasonable given what the agent could still see. Only a record of what was in context at each step shows where the constraint dropped.
Loop and cost runaway. An agent retries a failing step, varies its approach slightly, retries again. Per-call cost looks normal. Per-task cost is forty times what it should be, and nobody notices until the monthly bill. A step ceiling per task is the cheapest control in this entire article.
Confidently wrong completion. The agent finishes, reports success, and the output is wrong in a way that reads as plausible — a summary that inverts a decision, a CRM field updated with a correct-looking wrong value. Nothing in monitoring flags it. This is the failure mode evaluation exists for, and the reason evals sampled against production traffic matter more than a fixed test suite.
The pattern across all four: the agent's own report of what happened is not evidence. An agent that says it succeeded is making a claim, and observability is how you check it.
Observability is forensics. Gates are prevention.
Everything above is after the fact. A trace tells you what an agent did; it does not stop the agent doing it. For reversible work that is the right trade — you cannot approve every step of an agent that reads forty documents, and you would not want to.
For irreversible work it is the wrong trade. An email is sent. A record in a system of record is changed. Money moves. No trace undoes any of it, and the quality of your observability only determines how quickly you can describe what went wrong.
So the two work as a pair, split by reversibility:
- Reversible and internal — runs unattended, fully traced. Reading, searching, drafting, preparing. The trace is the control.
- Irreversible or external — stops at a human-in-the-loop approval point. The gate is the control, and the trace records what the approver saw.
That second line is worth being precise about. An approval gate where the human sees only "Agent wants to send an email — approve?" is theatre. The approver needs the action, the reasoning behind it, and what the agent looked at to get there. Which means your gates are only as good as your observability — the trace is what populates the decision.
Libra agents work this way by default: you set which tools an agent can reach, consequential steps stop at approval points you define, and every action is recorded in an audit trail that stays in your workspace. More on how we think about running agents in an organisation in AI agent governance, and on the threat side in AI agent security.
If you are starting from nothing, the order that pays off fastest: task traces with tool arguments and responses, then a step ceiling per task, then termination reasons, then approval events. Those four take a sprint and cover most of what you will actually be asked after an incident.